May 18, 2015
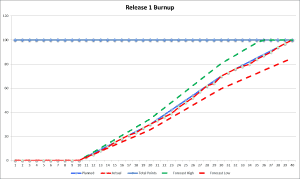
The release burnup chart shows an Agile team’s progress toward their release goal by identifying the work they have completed, or “burnt up.” The release burnup chart builds on the sprint burndown chart, which shows the team’s progress toward their sprint goal by identifying the work that has “burnt down,” Burnup charts can show the effect of scope changes with greater clarity than burndown charts can; they can also be stacked to show changes from one sprint to the next. With these added features comes one precaution: burnup charts are often harder to read than burndown charts. In this post, we will discuss ways of creating burnup charts, how they would be used, and best practices and pitfalls.
Continue reading→
April 20, 2015
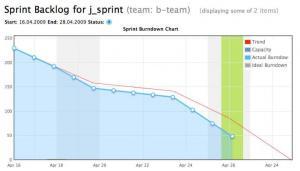
The sprint burndown chart is a key tool to monitor the progress of your team during a sprint. The chart measures remaining work against time. The sprint burndown chart’s primary purpose is to show whether the team will be able to complete the sprint work. Beyond this primary purpose, the sprint burndown chart can also expose the reality of how your team is performing.
Continue reading→
March 15, 2015
Resource allocation is a critical process on both Agile and traditional projects. Even the best-planned projects can’t be carried out if there are not enough people to do the project activities, or if they are too busy. Agile values teams delivering working software at the end of each sprint, collaborating closely with the customer, and managing their own output. To accomplish these goals, the team needs must be able to accurately assess its own capability based on reality rather than best guesses. The sprint capacity planning sheet is a powerful tool for teams to discover their capacity and deliver more realistic assessments of their ability to execute what is needed to finish a sprint.
Continue reading→
PMI, PMP, CAPM, PMI-ACP, PMI-RMP, and PMBOK are all registered marks of the Project Management Institute, Inc.


