May 18, 2015
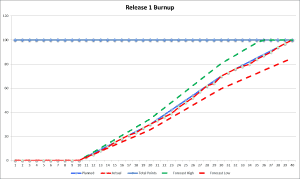
The release burnup chart shows an Agile team’s progress toward their release goal by identifying the work they have completed, or “burnt up.” The release burnup chart builds on the sprint burndown chart, which shows the team’s progress toward their sprint goal by identifying the work that has “burnt down,” Burnup charts can show the effect of scope changes with greater clarity than burndown charts can; they can also be stacked to show changes from one sprint to the next. With these added features comes one precaution: burnup charts are often harder to read than burndown charts. In this post, we will discuss ways of creating burnup charts, how they would be used, and best practices and pitfalls.
Continue reading→
PMI, PMP, CAPM, PMI-ACP, PMI-RMP, and PMBOK are all registered marks of the Project Management Institute, Inc.